Wednesday, June 15, 2011

AC Signals #1


The purpose of this lab was to practice measuring phase differences between AC signals that have the same frequency. Professor Mason set up his USB-based oscilloscope and demonstrated the exercises. We started with two different sinusoidal signals; they had the same frequency with different Vrms’s and a phase shift.


We first set the function generator to give a 1KHz signal with 6V peak-to-peak. We calculated the anticipated Vrms:
3V/sqrt(2) = 2.12V
This agreed with the DMM’s measured value of 1.97V. We then calculated the complex impedance of the 100nF capacitor in our circuit:
 Z=1/jwC = -716914.16j ohms
Next, we connected everything according to this schematic:

We then used the USB oscilloscope to measure peak-to-peak capacitor voltage on CH2: V=2V.
We also measured Vrms using the DMM and checked to make sure the measured and predicted values matched up.

Measured Vrms = 0.61V
Expected Vrms = 1/sqrt(2) = 0.707V

Our last measurement was the time difference between the two waveforms. We used the markings on the oscilloscope and counted 90uS of shift. From there we could calculate the phase angle between the two channels’ signals:

Φ = (90uS)(2π/450uS) = 1.26 radians

With the two signals overlapped on the oscilloscope, we could see that capacitor voltage led resistor voltage.

Friday, May 13, 2011

Oscilloscope 101

The purpose of this lab was to give us some practice with an oscilloscope.

Our first exercise goal was to display and measure a sinusoidal wave. First, we powered up the function generator and hooked it up to the scope. In the FG options, we set it to display a sinusoid with a frequency of 5kHz and peak-to-peak amplitude of 10V.
Next, we got everything on the oscilloscope dialed-in per the instructions (auto-scale, channel, horizontal control, vertical scale) to verify the FG's output. Based on our settings, here was our scale:

x-axis (time): 50μS
y-axis (voltage): 2V

Viewing the graph on the screen, we counted the boxes according to the scale. Our results confirmed our FG's settings; the peak-to-peak amplitude was 10V (5 boxes) , and the period was 180μS (1/180μS ≃ 5kHz).

We also calculated an anticipated RMS value, using the definition of Vrms=Vmax/sqrt(2). With a Vmax of 5V, we should get a Vrms of 3.54V. Verifying with a voltmeter, we measured a DC voltage of 0V and an AC voltage of 3.32V (3.54V), as expected.

Exercise 2 involved displaying a DC offset. We added a +2.5V offset on the FG, keeping all other settings the same on the FG and oscilloscope.

The result: the DC sinusoid was shifted up by 2.5V, but the AC sinusoid was not:


The voltmeter gave the same results: our VDC moved up to +2.51V, but VAC stayed at 3.32V.


This is because our voltmeter and oscilloscope distinguish between DC and AC voltage in a mixed DC/AC signal and ignore the constant value being added to the AC sinusoid.

For exercise 3, we set the FG to display a square wave with the same offset from exercise 2. The voltmeter measured a VDC of 2.51V, and a VAC of 5.24V.


We can use this to calculate our expected Vrms:

We calculated the area under the AC sinusoid (with an amplitude of 5.24V) over a period from 0 to π. We then divided the area of the sin wave by the area of the box, giving us 3.34V. This matches our VAC from exercise 2.

 Our last exercise involved guessing the characteristics of a "mystery signal" generated by Professor Mason, based on what showed up on our oscilloscope. Professor Mason tweaked the settings until two different signals were coming from channels 1 and 2. For the channel 1 signal, we used the scale on our oscilloscope to determine that the zero-to-peak DC voltage was 1V (2V peak-to-peak), with no offset (it was symmetrical WRT the y-axis). Our period was 4 boxes. At 10μS/box, the frequency was 1/(4*10μS) = 25kHz.


The channel 2 signal had a 0.1V zero-to-peak DC voltage (0.2V peak-to-peak) with a +0.3V offset. Our period was 4 boxes at 50μS/box. 1/200μS = 50kHz.


Tweaking scales to determine the characteristics of our mystery signal

Friday, April 29, 2011

Operational Amplifiers I

In our op-amps lab, we were presented with this problem:

We have a sensor whose output is between 0 and +1V, and a signal conditioning circuit whose output must range between 0 and -10V. The signal conditioning circuit cannot draw more than 1mA of current.
A model of the problem
This means that we need an inverting operational amplifier with a gain of -10 to make the conversion between the sensor's output and the conditioning circuit's output. The current limitation requires a specific value for resistor Ri.

We calculated this Ri using Ohm's Law:
R=V/I ; Ri = (1V)/(1mA) ; Ri = 1kΩ

Next, we calculated the value of the feedback resistor, Rf, corresponding to the desired gain. For an inverting op-amp:
Vo = -(Rf/Ri) Vi
Using this, we calculated an Rf of 10kΩ.

We needed a way to make a voltage source that varies between 0 and 1V, the voltage range for our sensor. We only have a 6V power supply, but can limit the input voltage to our op-amp by making Rx and Ry much smaller than Ri (this is a voltage divider).

To find Rx, we looked at the leg of the circuit to the left of the op-amp. Setting Ry to zero, we calculated the resistance that would produce a potential difference of 6V while operating at half power (1/8W).
Rx=289Ω  (closest available value: 360Ω)

After calculating Rx, we used KVL to find the Ry that would produce the 1V potential difference we're looking for.
Ry=71.8Ω  (closest available value: 68Ω)

Finally, we calculated the Thevenin resistance and voltage looking back from the op-amp at the left side of the circuit.
Rth=57.2Ω; Vth=0.955V
Since Rth was about 20 times smaller than Ri, we didn't have to worry about a loading effect on the input circuit.

Next, we built the circuit. We used a decade resistance box for Ry, tweaking it to achieve op-amp input voltages ranging from 0 to 1V. A multimeter was used to measure the corresponding voltage across Ri (the input voltage) and the output voltage.

Circuit on the breadboard
Adjusting the resistances. The reading on one multimeter is -10 times the other


These were our measurements. Taking the ratio of Vout to Vri, our gain was -10. Using Ohm's Law, we could also calculate the corresponding current through Ri. 


The circuit we built matches our design goals; we have a gain of -10, and the current drawn is no more than 1mA when the sensor is at its max value, 1V.

Monday, April 4, 2011

4/4/11 Homework Blog

For the first circuit, these were the values that I calculated using the equivalent resistance method and mesh analysis:
Vt = 43.07V
Rt = 7.47 kOhms

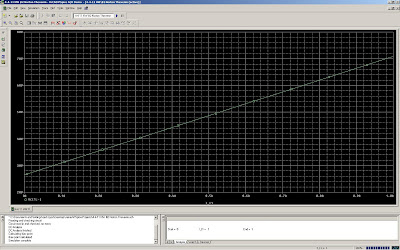
I drew up this circuit in PSpice, and just like with Wednesday's in-class work, I inserted a current source and swept it to find the Thevenin voltage. The y-intercept matched up with my 43.07V, and the slope was my 7.47 kOhms.
 

Click for larger
I could predict Norton current using Ohm's Law:
In= Vth/Rth = 5.77mA
I replaced the current supply with a voltage supply in PSpice and did a sweep. The intercept is about 5.77mA:
Click for larger
Finally, I used (Vth^2)/(4Rth) to predict that Pm = 62.08mW. This should occur when Rl=Rth. I drew up the equivalent circuit and swept the load resistor. The maximum on my graph was at f(7.47 kOhms)=62.08mW.
Click for larger

I used the exact same method to compute Vth, Rth, In, and max power in PSpice for homework problem #2; all of my predicted values agreed with PSpice's.

HW #2 Vth/Rth (click for larger)
HW #2 In (click for larger)
HW #2 max power (click for larger)

3/30/11 PSpice Lab (Thevenin, Norton, Max Power)

In our second PSpice lab, we used the schematic input method to compute Thevenin voltages, Thevenin resistances, Norton currents, and maximum power wattage.

First, we practiced building a circuit and probing for current and voltage values. This just required the placement of the individual elements and viewpoints.
Click for larger
Next, we used PSpice to calculate the Thevenin and Norton equivalents for a different, more complicated circuit. We drew up the circuit in Schematic and replaced the element we're finding Vth with respect to with a current supply. We then set up a simulation to "sweep" (or vary) the current over a set of values and plot the results. The 20V corresponding to a current of 0A (the y-intercept) is our Vth; the slope of our line, 6 Ohms is Rth (because R=V/I).
Replacing the load with a current supply to find Vth
 Thevenin voltage is the intercept; Thevenin resistance is the slope (click for larger)

Norton current can be found by replacing the current supply with a voltage supply and sweeping the voltage. The 3.33A corresponding to a voltage of 0V is our In.
 Norton current is the intercept; Thevenin resistance is the inverse of the slope (click for larger)
Armed with Thevenin and Norton values, we drew up an equivalent circuit in order to find the maximum power dissipated across a load resistor. We used the parameter table to create a resistor that is swept across a series of values. After simulating, we plotted voltage*current and looked for the maximum. The y-value (250mW) was our maximum power, and the x-value was the corresponding load voltage that gave us this max power (it was equivalent to Rth, which was expected).

Maximum power (click for larger)

Friday, April 1, 2011

Thevenin Equivalents

For Thevenin Equivalents, we are given a circuit and want to know how a change in one element (Rl2) affects the circuit as a whole. We can simplify this calculation by reducing everything else in the circuit to an equivalent Thevenin resistance and voltage.


The first step involved calculating Vth, which we were able to do with nodal analysis. We open-circuited the terminals across Rl2 and found the voltage in a parallel element.


Vth = 8.64 V


We then open-circuited the terminals across Rl2 and found the current flowing through. We could then put this current and Vth together in Ohm’s Law to find the Thevenin resistance, Rth. As a check, we solved for Rth using the parallel/series equivalent resistance method.


I = 0.131 
Rth = 65.9 Ohms


With the circuit now simplified to three elements (Vth, Rth, and Rl2), we calculated the Rl2 corresponding to the minimum voltage (8V) allowed across this element. We then solved for the short-circuit current and open-circuit voltage.


Rl2min = 823.75 Ohms
I = 0.009711 A
V = 8V


Next, we put together the circuit. We used a voltage supply for Vth, a resistor box set to 66 Ohms for Rth, and another resistor box for Rl2. We measured the voltage across the load for two cases: one where Rl2 = Rl2min and one where Rl2  = infinity (an open circuit).


The Thevenin circuit 


These were our measurements:


 Config      Theoretical         Measured            % Error
Rl2=Rl2min                     8V           7.59V 5.12%
Rl2=infinity          8.64V         8.47V1.97%

Monday, March 28, 2011

PSpice

The results of the tutorial
After using PSpice for the the tutorial, these are some notes that helped me work through problem 6 on assignment 8:
  • Remember to place a ground; the "floating node" error I had was the result of not defining a ground voltage.
  • I kept having to add libraries and hunt around for the part locations. Resistors are under "ANALOG," voltage sources and current sources are under "SOURCE," and grounds are under "0."
  • I try to keep the wire as clean as possible, i.e., using a single wire to connect elements instead of patching a bunch together.
  • Make sure the wire is not passing through a circuit element. This can mess everything up and is sort of tricky to spot.
  • You can end wire or element placement by pressing Esc (instead of right clicking).
  • Define another target directory to save projects in, as the default one is buried way within the C:/ volume somewhere.
  • Be sure to apply settings once you've edited them in the configuration window.
  • After running the simulation profile, you can click on the I and V buttons to display all voltages and currents in the circuit.
For the homework assignment, I first worked out the solutions by hand for some nodal analysis practice:


After this, I went through and drew up the circuit in PSpice. It was very similar to the tutorial because the parts were mostly identical. The only new element was a voltage source, which was also located in the "SOURCE" library. I created a simulation profile and brought up the currents and voltages. The results verified my answers, because 

12.31 mA * 25 V = 307.75 mW = Pv
and 
3.208 mA * 2 kOhms = 6.416 V = V1

The PSpice model of #8